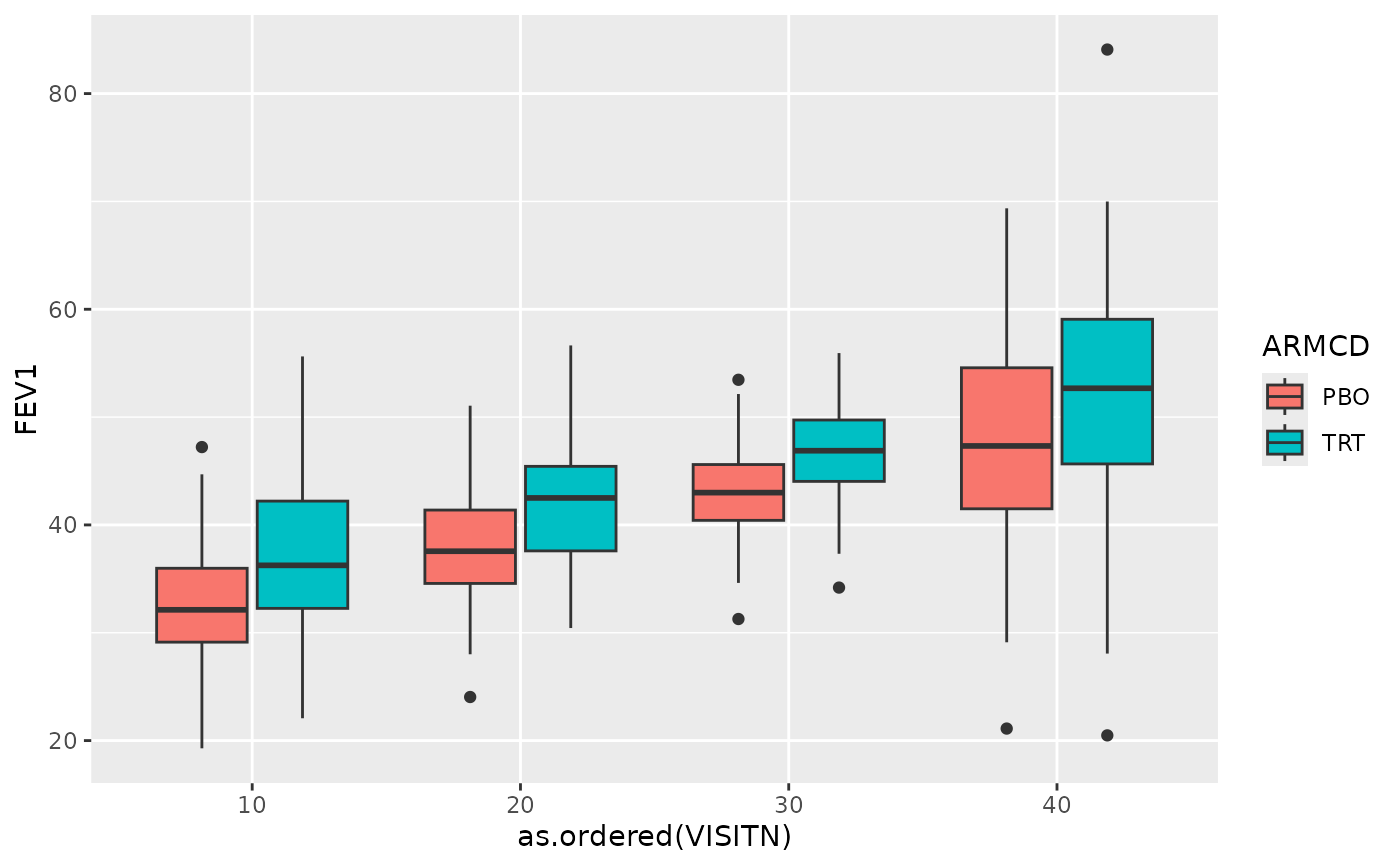
Plot Outcome Variable by Timepoint and Study Arm
Source:R/extras.R
plot_outcome_by_visit_and_group.RdPlot a continuous outcome for each combination of scheduled visit and study arm.
Usage
plot_outcome_by_visit_and_group(
  data,
  outcome_var,
  scheduled_timepoint_var,
  group_var,
  ...,
  geom = ggplot2::geom_boxplot,
  geom_args = list(na.rm = TRUE)
)
Arguments
- data
(
data frame)
The data frame that will be supplied toggplot2::ggplot().- outcome_var
(
numeric)
The continuous outcome variable to supply to theyargument ofggplot2::aes(). Whatever is supplied will be quoted and evaluated in the context ofdata.- scheduled_timepoint_var
(
ordered)
The variable containing the scheduled timepoints to supply to thexargument ofggplot2::aes().. Whatever is supplied will be quoted and evaluated in the context ofdata.- group_var
(
numeric)
The grouping variable (probably the study arm) to supply to thefillargument ofggplot2::aes().. Whatever is supplied will be quoted and evaluated in the context ofdata.- ...
Forwarded onto
ggplot2::ggplot(ggplot2::aes).- geom
(
function)
Theggplot2"geom" to use. Defaults toggplot2::geom_boxplot().- geom_args
(
list)
A list of arguments to supply togeom. Defaults tolist(na.rm = TRUE).
Value
A ggplot object.
Examples
# Create a usable data set out of mmrm::fev_data
fev_mod <- mmrm::fev_data
fev_mod$VISITN <- fev_mod$VISITN * 10
fev_mod$time_cont <- fev_mod$VISITN + rnorm(nrow(fev_mod))
fev_mod$obs_visit_index <- round(fev_mod$time_cont)

plot_outcome_by_visit_and_group(
    data = fev_mod,
    outcome_var = FEV1,
    scheduled_timepoint_var = as.ordered(VISITN),
    group_var = ARMCD
)